What Is a Good Freshman Retention Rate? Four Numbers to Check
Sep 28, 2026
Colleges publish a number that tells you roughly how many students who arrived last fall were still enrolled there the following fall.
That number is useful because students leave colleges for many reasons: academic fit, affordability, personal circumstances, transferring to another institution, or dissatisfaction with the experience. Retention does not tell you which reason applies. What it does tell you is how consistently a college keeps its first-year students enrolled.
Think of retention as a persistence indicator, not a satisfaction score. It is standardized, publicly available, and surprisingly useful when you compare similar colleges.
There are three more numbers worth checking alongside it. Here is what all four mean, what counts as good, and, more usefully, what they mean in combination.
On this page
- The Short Answer
- What Is a Freshman Retention Rate?
- What Is a Good Freshman Retention Rate?
- What Does Retention Not Tell You?
- Number Two: Graduation Rate
- Number Three: Outcomes in the Intended Major
- Number Four: Class Size and Faculty Access
- How to Read the Four Numbers Together
- Where Do You Find These Numbers?
- How Should These Numbers Shape Your List?
- FAQ
The Short Answer
Freshman retention is the share of first-year students who return to the same college for sophomore year.
The national average at four-year institutions is about 82 percent.
Do not compare every college against that national number. Retention varies significantly with selectivity, institutional mission, and the characteristics of the students a college enrolls.
Highly selective colleges often post retention rates in the mid-90s. Less-selective and open-admission institutions tend to have lower rates.
There is no single retention-rate cutoff that defines a good college. Compare schools with similar admission rates, missions, and student populations.
The four-year graduation rate is often the more revealing number, and the gap between the four-year and six-year rates can tell you whether a significant share of students takes longer than four years to finish.
For career outcomes, earnings by field of study are generally more useful than institution-wide averages because different majors lead to very different earnings patterns.
Student-to-faculty ratio is a weak proxy for the classroom experience. Class-size distribution and the size of courses in your student's intended major are more useful questions.
Read all four numbers together. Any one of them in isolation can mislead.
What Is a Freshman Retention Rate?
The federal definition is designed to make these numbers broadly comparable.
Among first-time, full-time bachelor's degree-seeking students who entered in the fall, what percentage are still enrolled at that institution the following fall or, in rare cases, have already completed the bachelor's degree?
So a cohort of 1,000 students with 850 still enrolled the following fall produces roughly an 85 percent retention rate.
A few mechanics are worth knowing.
Institutions can remove a small number of students from the cohort for specific allowable reasons, including death, total and permanent disability, certain military service, service in a federal foreign aid program such as the Peace Corps, or official church mission service.
Students who transfer to another college or drop out both reduce the institution's retention rate.
A student who returns to the same college but changes from full-time to part-time can still count as retained. The student's original cohort is based on enrollment status when the student first entered.
What Is a Good Freshman Retention Rate?
The national average across four-year institutions is about 82 percent.
But the national average is not necessarily the benchmark you want because retention varies considerably across different types of colleges.
Recent federal data illustrate the pattern:
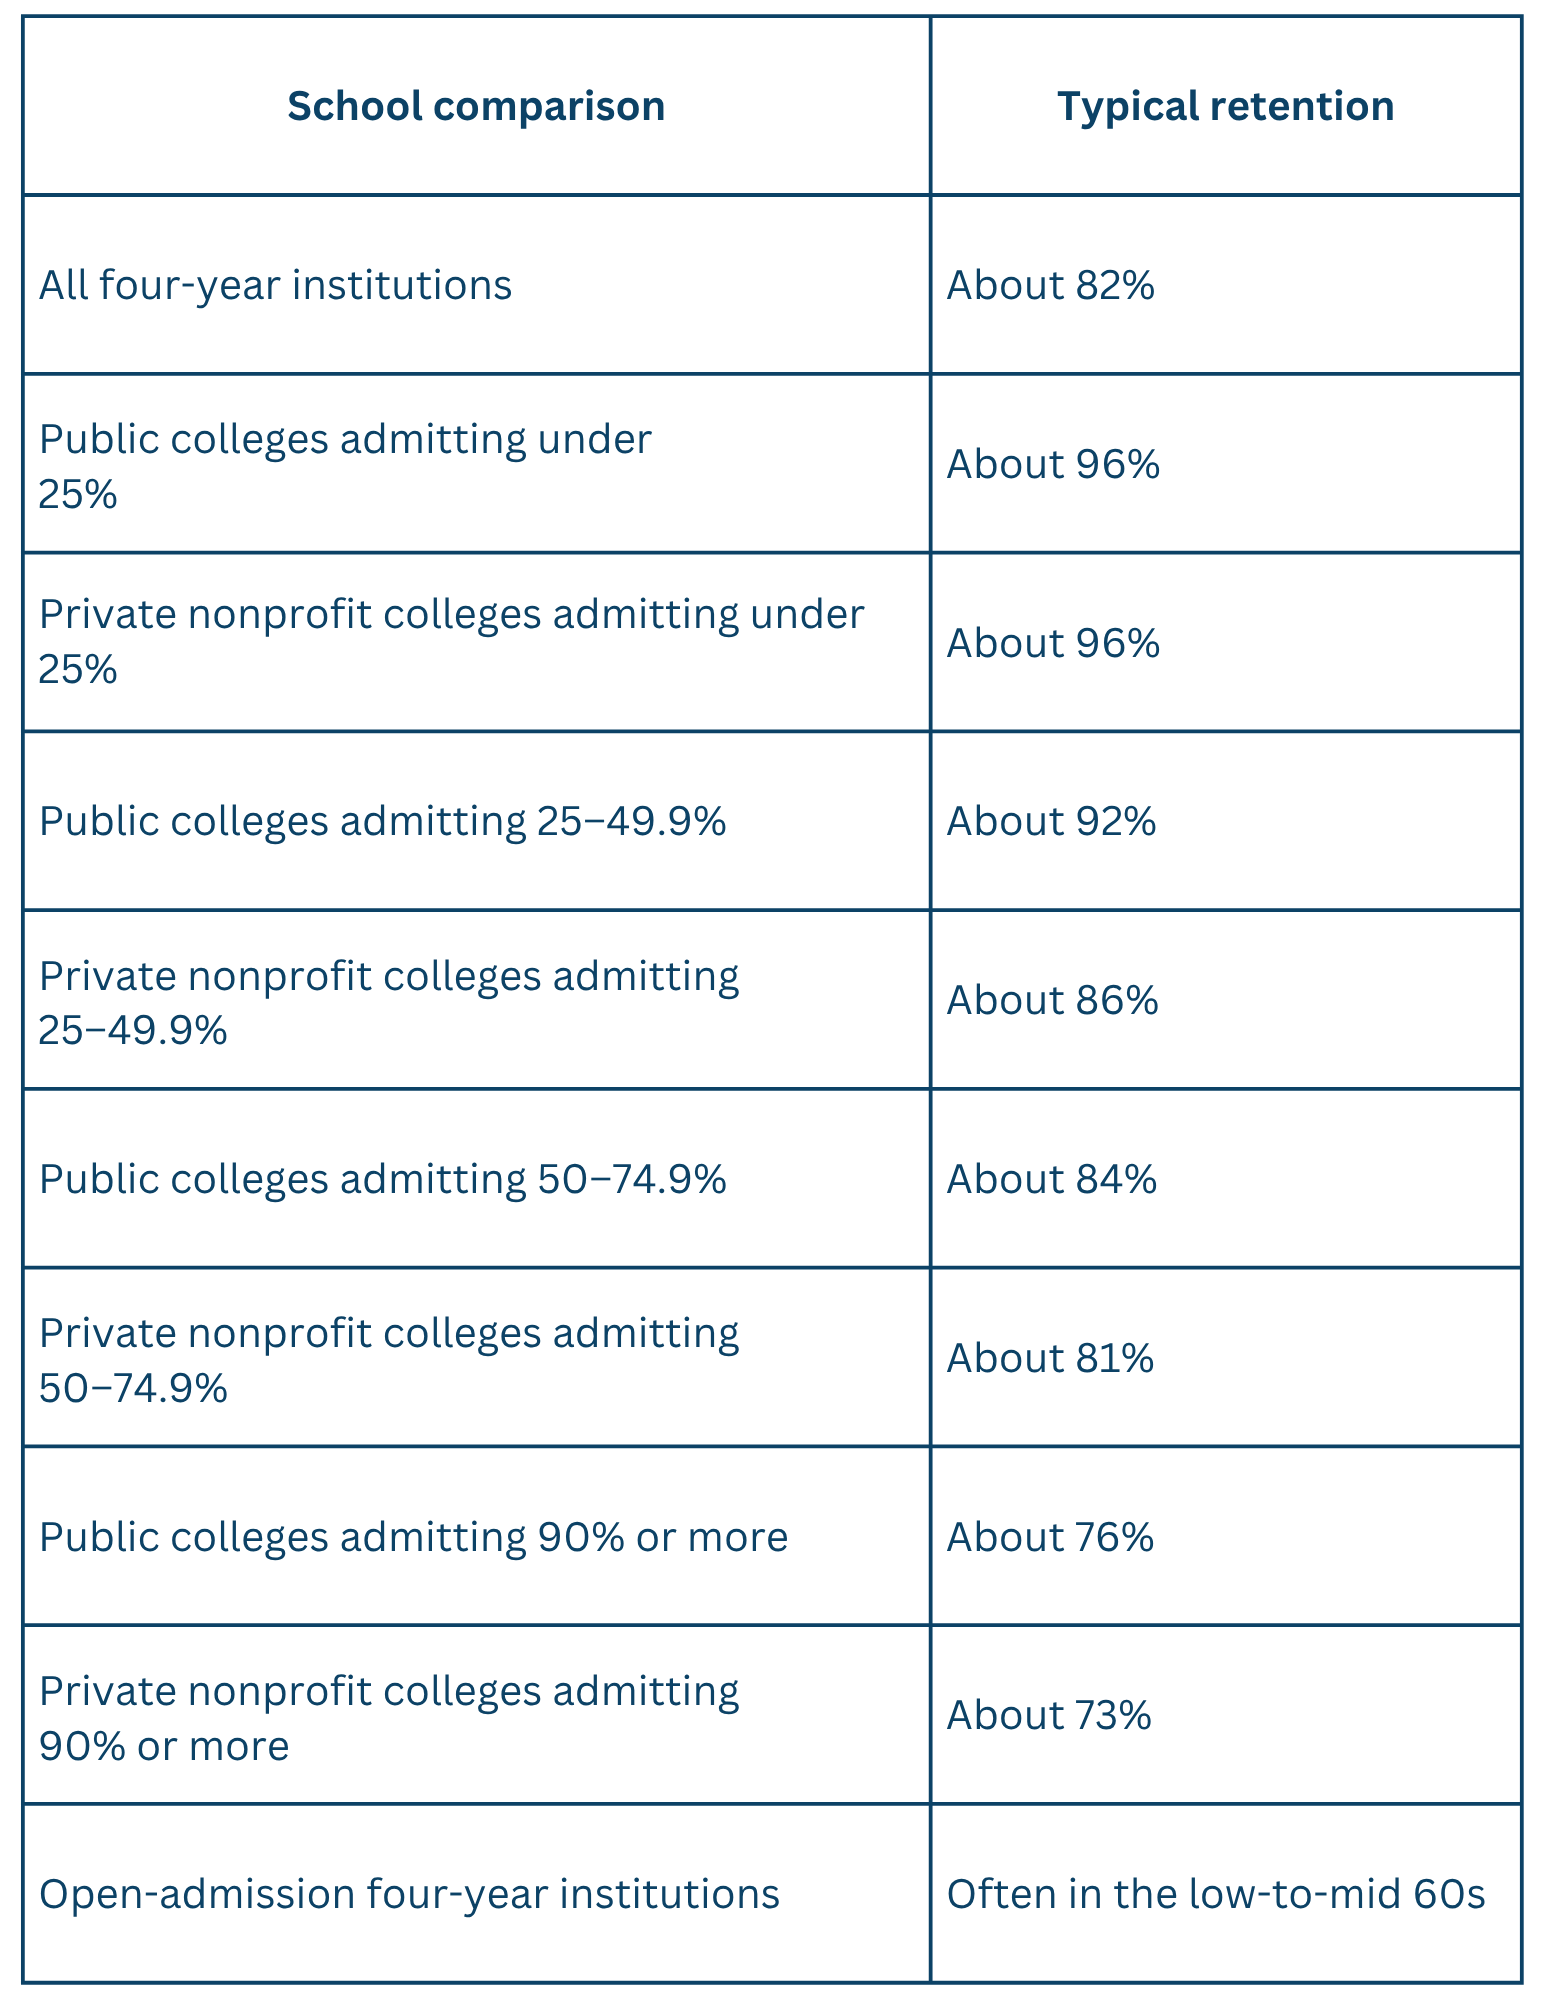
Read that table as a warning about lazy comparisons.
A 78 percent retention rate may look weak next to a highly selective university with a 96 percent rate. But at a college admitting nearly every applicant, 78 percent may actually compare favorably with similar institutions.
The more useful question is:
How does this college's retention rate compare with schools that have similar admission rates, missions, and student populations?
If a school's retention rate is substantially lower than comparable colleges, that is worth investigating.
Ask the admissions office what they believe is driving the number and what the institution is doing to improve student persistence.
A specific answer is more useful than a vague one.
What Does Retention Not Tell You?
A number this convenient is easy to over-read.
Here are four limitations to keep in mind.
Transferring out counts against the institution. A student who leaves for another college, finds a better fit, and eventually graduates still lowers the original school's retention rate. Retention measures whether a college keeps students enrolled, not whether every departing student ultimately succeeds.
Retention is strongly associated with selectivity and the characteristics of the entering class. Highly selective schools partly post high retention rates because they enroll students who, on average, arrive with strong academic preparation and other advantages. Retention therefore reflects both the students an institution enrolls and what happens after they arrive.
Cost can contribute to departures. Students sometimes leave because the college becomes unaffordable, particularly when families face substantial unmet financial need. A retention problem can therefore have a financial component as well as an academic or social one.
Small cohorts produce noisy numbers. At a college enrolling only a few hundred first-year students, a relatively small number of departures can move the retention rate several percentage points. Look at several years of data rather than drawing conclusions from a single year.
Number Two: Graduation Rate
Retention tells you about persistence after year one.
Graduation rate tells you whether students eventually finish.
For a standard four-year bachelor's program, the two numbers most useful to families are the percentage graduating within four years and the percentage graduating within six years.
Six years represents 150 percent of the normal completion time and is the graduation rate required for federal Student Right-to-Know disclosure. Federal data also include other completion windows.
The gap between the four-year and six-year numbers can be useful.
A school with a 45 percent four-year graduation rate and a 78 percent six-year graduation rate is telling you that a substantial number of students who eventually graduate take longer than four years.
That is worth investigating.
Possible explanations can include:
- Required courses that are difficult to access
- Changes of major
- Complicated major requirements
- Students working substantial hours
- Co-op or other structured programs that extend the timeline
- Advising issues
- Personal circumstances
The numbers themselves do not tell you which explanation applies.
Taking longer to graduate can also have financial consequences. An additional year may mean additional tuition, fees, housing, and living expenses, along with delayed entry into full-time employment.
That makes graduation timing worth considering when comparing the potential cost of two colleges.
A narrower gap between the four-year and six-year rates simply means fewer additional students in that cohort graduate during years five and six.
It does not, by itself, prove that a school has a clearer academic path or better advising.
One more limitation matters.
Traditional federal graduation rates primarily track students who began as first-time, full-time students and measure whether they completed a credential at the institution being reported.
Students who transfer elsewhere and graduate are not credited as graduates of the original institution in that traditional institutional graduation rate.
At colleges with substantial transfer activity, that means the number does not tell you the complete story of what ultimately happened to every student who started there.
Number Three: Outcomes in the Intended Major
This connects the academic decision to what happens after graduation.
And it is where families often rely on a number that is too broad to be useful.
An institution-wide earnings figure blends graduates from engineering, education, business, social work, computer science, communications, nursing, and dozens of other fields with very different labor-market outcomes.
As a result, the school's overall earnings figure can reflect its mix of majors as much as anything else.
Look instead at earnings and debt by field of study.
College Scorecard publishes program-level earnings and federal student debt information for many institutions and fields of study.
That allows you to compare, for example, biology graduates at several colleges rather than comparing the overall earnings of one university with another.
Two important caveats apply.
First, College Scorecard's federal earnings data cover students who received federal student aid, so the figures do not necessarily represent every graduate.
Second, the data lag because graduates need time to enter the workforce before their earnings can be measured.
For a fuller picture, add the school's own career outcomes report when one is available.
Look for the knowledge rate: the percentage of graduates for whom the school has reliable outcome information.
Career outcomes information can come from graduate surveys as well as verified sources such as employers, faculty, and institutional records.
A low knowledge rate means the published outcomes represent a smaller share of the graduating class, so interpret them more cautiously.
Number Four: Class Size and Faculty Access
The student-to-faculty ratio is one of the most frequently quoted college statistics and one of the easiest to misunderstand.
A 12-to-1 student-to-faculty ratio does not mean the average student sits in a class of twelve.
The ratio is calculated using full-time-equivalent students and instructional faculty. Part-time students and part-time faculty are converted into fractional full-time equivalents.
It is also not purely a measure of undergraduate classroom instruction.
The calculation can include graduate students and instructional faculty associated with graduate education, although students and faculty in qualifying stand-alone professional programs such as medicine and law are excluded.
Graduate teaching assistants are not counted as faculty in the ratio.
The result is that two colleges reporting identical student-to-faculty ratios can still offer very different classroom experiences.
Class-size distribution is more useful.
The Common Data Set publishes class-size information in section I, including the number of undergraduate class sections that fall into different size ranges.
That gives you a more direct picture of how many classes have fewer than twenty students, how many have twenty to forty-nine, and how many are much larger.
Better still, ask:
How large are the introductory courses in my student's intended major, and who teaches them?
At some universities, graduate teaching assistants teach or lead undergraduate course sections, laboratories, or discussion groups.
That is not automatically a negative. Many graduate instructors are excellent teachers.
It is simply useful to know before enrolling.
Because graduate teaching assistants are excluded from the faculty count used for the student-to-faculty ratio, that ratio does not tell you how much undergraduate instruction they provide.
Ask about this on the campus visit.
Admissions staff can provide the institutional answer. Current students can often tell you what the experience actually feels like.
How to Read the Four Numbers Together
Individually, each number has limitations.
Together, they can help you identify questions worth asking.
High retention, high four-year graduation.
This is generally an encouraging combination. Most students remain after the first year, and a large share of the entering cohort finishes within four years.
High retention, low four-year graduation.
Most students remain after the first year, but a substantially smaller share finish within four years.
That deserves investigation.
Possible explanations include course availability, major requirements, changes of major, co-op programs, work obligations, advising, or other factors.
The numbers themselves do not identify the cause.
Low retention, with a six-year graduation rate relatively close to it.
This pattern suggests that much of the cohort loss may occur relatively early, but do not assume that everyone who persists through the first year eventually graduates.
Students can stop out and later return, and retention and graduation rates measure different points in the student experience.
A low first-year retention rate is still worth investigating.
Strong institutional numbers, weak outcomes in the intended major.
A college can perform well overall while a particular program produces different outcomes.
That is why program-level information can be more useful than institution-wide averages.
Good retention, large introductory classes.
There is no contradiction here.
Many students succeed at universities with large lecture courses.
It simply means your student should understand the teaching environment before enrolling.
Everything strong except cost.
Academic fit and outcomes matter, but affordability belongs in the analysis from the beginning.
A college can look excellent on every other measure and still be the wrong choice if the financial fit does not work for the family.
Where Do You Find These Numbers?
Most of this information is available through free public sources.
College Navigator carries retention and graduation rates along with basic institutional data. It also allows you to save schools for comparison and export search results.
College Scorecard carries graduation rates, costs, federal student debt information, and earnings data by field of study.
The Common Data Set, which many colleges publish annually, includes retention and graduation information in section B and class-size distribution in section I.
Search the school's name plus "Common Data Set."
The school's career outcomes report, when available, is usually published by the career center or institutional research office.
Record these numbers in one place as you research.
A simple row for each college with retention, four-year graduation, six-year graduation, career outcomes, class-size notes, and your own observations will make comparison much easier later.
How Should These Numbers Shape Your List?
Use them as a filter after evaluating overall fit and before finalizing the list.
Do not turn them into another ranking system.
They are most useful for identifying something you would otherwise have missed.
Maybe you loved the campus visit but later discover that the retention rate is noticeably lower than at comparable colleges.
Maybe the university has an excellent reputation but a much lower four-year graduation rate than you expected.
Neither automatically disqualifies the school.
Both give you something specific to investigate before your student applies or enrolls.
These numbers are least useful when treated as simple proxies for quality.
Retention and graduation outcomes are strongly related to the types of students institutions enroll. If you simply chase the highest numbers, you will tend to push the list toward the most selective colleges.
That is not the same thing as building the best list for your student.
The framework for the rest of the process is in our guide to How to Build a Balanced College List.
Frequently Asked Questions
What is a good freshman retention rate?
It depends on the type of college.
The national average across four-year institutions is about 82 percent, while many highly selective institutions retain students at rates in the mid-90s. Less-selective and open-admission institutions generally have lower rates.
There is no universal cutoff that defines a good retention rate.
Compare the college with institutions that have similar admission rates, missions, and student populations. A rate substantially below comparable schools is worth investigating.
How is the freshman retention rate calculated?
For the federal full-time retention measure, colleges begin with first-time, full-time bachelor's degree-seeking students who entered in the fall.
After a small number of allowable exclusions, the institution calculates the percentage who are still enrolled at that college the following fall or, in rare cases, have already completed the bachelor's degree.
Students who transfer elsewhere or leave college reduce the institution's retention rate.
A student who returns to the same college but switches to part-time can still count as retained.
What does a college graduation rate actually mean?
Traditional federal graduation rates measure the share of an entering cohort that completes a degree or credential at the reporting institution within a specified period.
For bachelor's programs, families commonly compare four-year and six-year graduation rates.
These traditional rates focus primarily on first-time, full-time entering students and do not credit the original institution when a student transfers elsewhere and graduates from another college.
That is one reason graduation rates should be interpreted in context.
What is the difference between the four-year and six-year graduation rate?
The four-year rate tells you what share of the entering cohort completed a bachelor's degree within four years.
The six-year rate measures completion within 150 percent of the normal time for a four-year degree.
A large gap means a substantial additional share of students graduates during years five and six.
It does not tell you why.
Course availability, changes of major, co-op programs, work obligations, personal circumstances, or other factors may contribute, so investigate rather than assuming a cause.
Does the student-to-faculty ratio matter?
It provides some information, but less than many families assume.
A 12-to-1 ratio does not mean the average class contains twelve students.
The calculation uses full-time-equivalent students and instructional faculty, includes some graduate activity, and excludes graduate teaching assistants from the faculty count.
Class-size distribution in section I of the Common Data Set usually gives you a better sense of the undergraduate classroom experience.
Better still, ask about class sizes in your student's intended major.
Where can I find college outcomes data?
College Navigator provides retention and graduation rates.
College Scorecard provides graduation rates, cost information, federal student debt data, and earnings by field of study.
Many colleges publish a Common Data Set containing retention and graduation information in section B and class-size information in section I.
Career centers and institutional research offices may also publish graduate outcomes reports.
When reviewing a career report, look for the knowledge rate so you know how much of the graduating class is represented by the data.
Why does earnings data by major matter more than the school average?
Because different majors have very different labor-market outcomes.
A university with large engineering and computer science programs may have higher overall graduate earnings than a university where more students study education or social work.
That does not necessarily tell you which institution provides a better education.
College Scorecard's field-of-study data allow you to compare graduates from similar programs across different schools, which is often much more useful.
Is a low retention rate always a bad sign?
No.
Retention varies considerably by institution type and student population.
Open-admission schools generally have lower retention rates than highly selective institutions. Small colleges can also experience noticeable year-to-year changes because relatively few students can move the percentage.
And students leave for many different reasons, including transferring elsewhere, affordability, family circumstances, academic issues, or dissatisfaction.
A lower-than-expected retention rate is a question to investigate, not an automatic reason to eliminate a college.
Should we ask the college about a low retention rate?
Yes.
If a school's retention rate looks unusually low compared with similar institutions, ask what the college believes is contributing to it and what has changed in recent years.
A specific answer can provide useful context.
Current students can also be helpful sources when asking about advising, course availability, campus life, and class sizes.
How much should these numbers weigh in the final decision?
Use them as a filter, not a ranking.
They are best at helping you catch something you might otherwise miss, such as an unexpectedly low retention rate or a large difference between four-year and six-year graduation.
They are much less useful as simple measures of college quality because retention and graduation rates are strongly related to the students an institution enrolls.
The goal is not to find the college with the highest numbers.
It is to understand what the numbers tell you about the experience your student is considering.
Ready to Talk?
Reading these numbers across a full list, and knowing which gaps are worth worrying about, is the kind of thing that changes a list before applications go out rather than after. Book here to work through it with one of our advisors. The Admission Strategy Session is a free call!
You can also ask AskAnji, our admissions AI trained on the way we advise here.
We're committed to supporting all students with free resources like this article. Join our community and receive powerful tips you can apply today as you build your list and prepare your applications. From our free videos to AskAnji, our carefully curated and trained proprietary AI assistant available 24/7, we've got you covered.
For the full process, start with our guide to how to build a balanced college list.